Challenges
In order to improve the user experience of visitors, tourist destinations are turning to new technologies, which implies the digitalisation of business, and today, almost as a rule, the application of artificial intelligence. At Brijuni National Park, there is a desire to better manage visitor flows and improve their experience.
Solution
As part of the Test Before Invest (TBI) service, the digital solution tested for NP Brijuni shows how modern tools such as artificial intelligence, computer vision and IoT can be used to collect useful data on visitors' movements and interests.
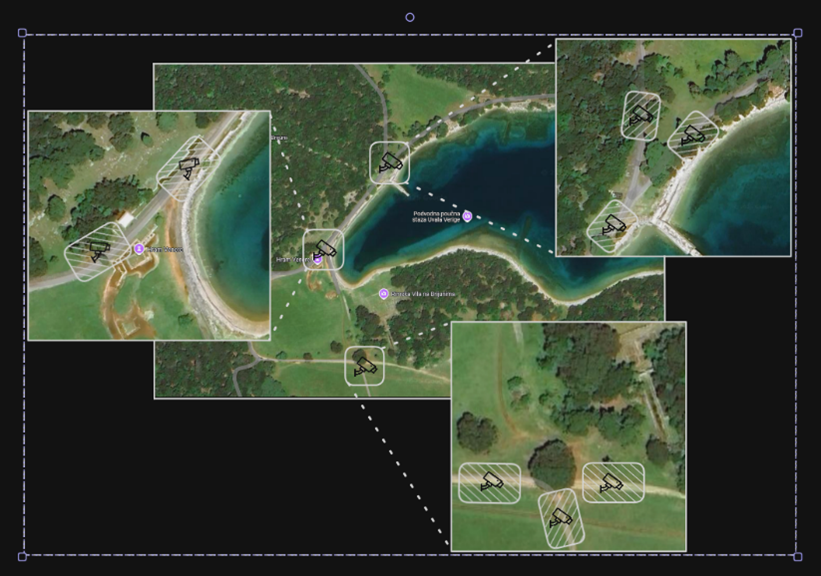
Figure 1 Proposed position of surveillance cameras in the area of Verige Bay in the Brijuni National Park
The satellite image shows the area of the Verige bay in the Brijuni National Park (Figure 1) with enlarged details of four different parts of the location, where proposals for the location of surveillance cameras (camera symbols with lines over them) are marked. The proposal is for cameras to be deployed along the trails and the coastline, covering key access points and visitor movement areas. The goal of installing cameras is surveillance, safety and protection of natural space.
How does the system work?
The core of the system consists of architecture (Figure 2) that allows real-time detection and counting of people based on video transmission of cameras. The system uses Python, YOLOv3 model for object detection, OpenCV library, REST API and PostgreSQL database.
The process of collecting data from images and processing takes place as follows:
- Video transmission: cameras continuously send the recording to the processing module.
- Video processing: The image is separated into so-called frames that are forwarded to the AI model.
- Detection: The YOLO model recognizes the people in the image and generates data about their location and detection security.
- Marking: Detected objects are visually marked on frames using the OpenCV tool.
- Data storage: data on the number of people is recorded in the database every few minutes, and this is a parameter that can be adjusted as needed.
- Presentation of data: The user interface displays data in the form of graphs, tables and other visual representations, depending on the need.
The system allows you to choose the level of detail – for example, the number of people per minute or the average number of people at 5-minute intervals. Thus, users have an overview of the situation on the site at all times.
Technologies that drive the system
- Backend:
Python, YOLOv3, OpenCV, PostgreSQL, REST API - Frontend:
Angular - Cameras:
Continuous video transmission, without recording storage
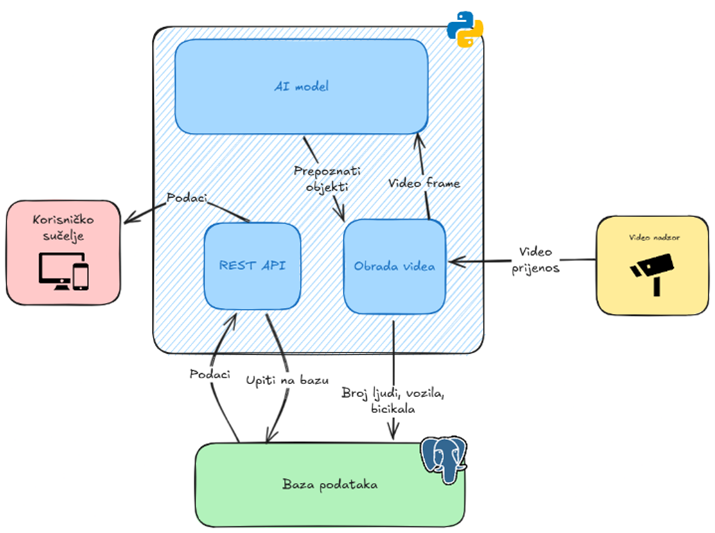
Figure 2 System architecture
Focus of testing
The testing focused on:
- Reliability of the system
- Accuracy of data
- Adaptability to the specifics of the destination
- Scalability
The tested solution not only enables precise counting of visitors, but also gives insights into the load of individual locations, and is also in line with the GDPR directive since no pictures or videos are stored anywhere. The collected numerical data can be used for:
- Planning a visitor's stay and route without a guide
- Development of educational materials
- Adjusting content to the interests of visitors
- Optimization of their movement and experience
Conclusion
This solution represents a step towards smarter and more sustainable management of tourist areas. By using the described technology, destinations such as Brijuni National Park can create preconditions for the offer of more personalized tourist products with the aim of achieving a better user experience, reduce the crowds and burden of individual sites, better manage the destination and use their resources more efficiently.